Beating the system: building the ultimate Fantasy NBA optimizer
I predict for a living. Actuaries carry a charmingly simple worldview: if none of the pre-identified variables change, next year’s world is exactly today’s — and when it inevitably isn’t, we chalk the difference up to an “exogenous variable,” or “risk,” or some other buzzwordy lingo for the stuff we didn’t see coming. Years of rigorous training in probability theory, predictive analytics, and credibility theory go into the attempt. Suffice it to say, I want to put my actuarial crystal ball to good use.

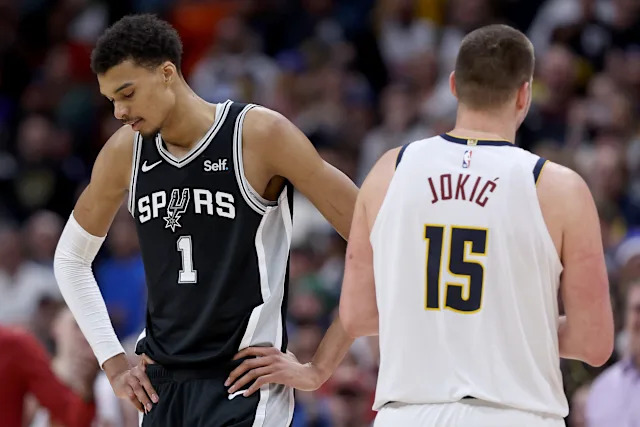
My love of ball, going back to high school, has grown into a long career in fantasy NBA — a near full-time gig that calls for perusing player stats, trash-talking rival managers, cursing the one player who decides to chuck brick after brick to humor me, and weathering the very real risk of a mild depression after an unpredictable season-ending injury. My league runs an auction draft, which turns every player into a price-tag question: not just is he good? but how much, exactly? So I did the natural thing and built a tool to tell me what each player is actually worth, and how high I should go when his name comes up.
New to fantasy basketball?
It’s a game you play against other people using real NBA players. You “draft” a roster of them, and each week their actual stats from real games — points, rebounds, assists, and so on — get tallied up and matched head-to-head against a rival manager’s team. Real players, real numbers in your own “fantasy” team; and you are the GM!
The hard part isn’t knowing who’s good. It’s the clock. A player gets put up for bid every thirty seconds, and you have to answer the same question over and over: bid or pass — and if bid, how much? Spend too fast and you’re broke by the third round. Spend too slow and you end the night with cash you can’t use.
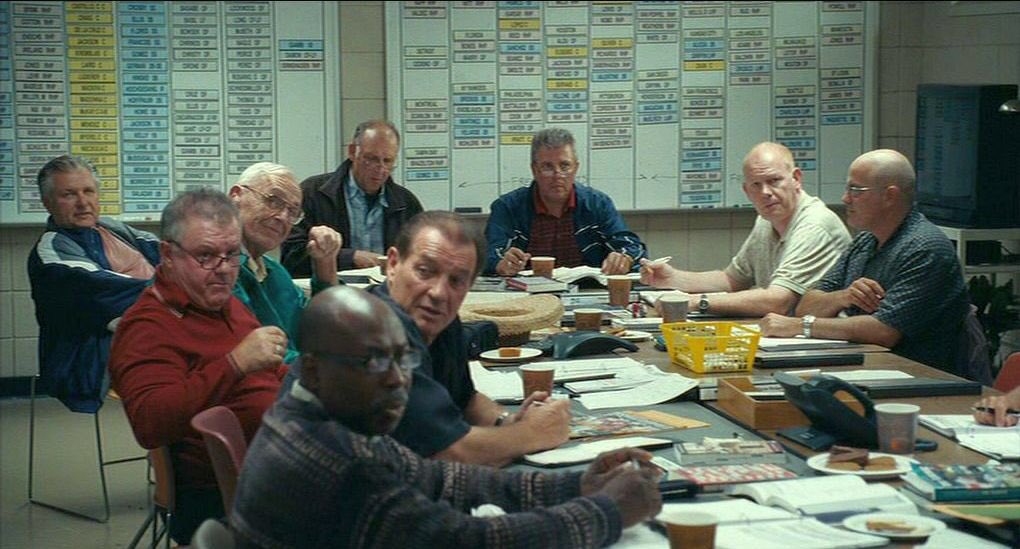
The romantic in me wants to just wing it — after all, it’s just a game… albeit a game I find myself getting increasingly invested in toward the end. Trust the gut — aka your intuition, aka the sniff test, aka the eyeball test. But I’m reminded of that scene in Moneyball where the old scouts write a prospect off because his girlfriend’s “a 6, at best” — so, the logic goes, the kid must lack confidence in himself. They say it with total conviction and zero actual signal: a completely subjective “feel,” dressed up as “experience.”
I’m not that cringey or clueless. I had plenty of gut intuitions about these players and their numbers, and I didn’t want to throw them away — I wanted to give them structure and operationalize them, turning a hunch into something I could compute, repeat, and defend. Because the goal of these things — projection models, machine learning, the same kinds of tools I use at work — is to support decision-making within the constraints, not to quixotically flatten a real-world problem, with all its nuances and complexities, into a fully solvable one.
The format
The league is a twelve-team, head-to-head, nine-category auction. That mouthful just means a few hard rules:
- $200 to build your whole team — not a dollar more
- exactly 13 roster spots, with certain positions that have to be filled
- you win each week by beating your opponent in nine stat categories (points, rebounds, assists, steals, blocks, threes, field-goal %, free-throw %, turnovers)
Once you write it out like that, it stops being a vibe and becomes a math problem — specifically a bounded constraint optimization problem.
Bounded constraint optimization
A fancy name for a simple idea: get the most value you possibly can while staying inside hard limits. The budget is a limit. The roster size is a limit. The positions are limits. My job on draft night is to squeeze the most production out of those boxes.
Here’s the whole engine in one picture:
Guessing the season ahead
First you have to predict what a player will do. For a steady veteran that’s easy — he’ll probably do roughly what he did last year. The trouble is the small samples: rookies, or someone who barely played. Their numbers are real but flimsy, and if you trust them blindly you’ll get burned.
The idea I lean on is called Bayesian shrinkage, and it’s just common sense dressed up: when you don’t have much data on someone, don’t over-trust it — nudge your guess toward what a typical player like him does. The more a player has actually been on the court, the more I let his own numbers speak for themselves.
Actuary translation
This is exactly what we call credibility: a driver with one year of history gets judged partly on his own record and partly on people like him. Same move, different sport.
From a stat line to a dollar sign
Now the harder question: what is that production worth in this league? You can’t just add up points — a rebound and a steal aren’t worth the same, and the value depends on what everyone else is doing.
The trick is a z-score: for each category, measure how far above average a player is, counted in standard deviations (basically, “how unusual is this?”). A guy who’s two standard deviations above average in assists is genuinely rare and gets credit for it. Add up a player’s z-scores across all the categories and you get a single number for how much he helps you.
Then I compare everyone to a replacement level — the worth of the last player who’d ever get drafted at all. You only really pay for what a player gives you above that freely-available baseline, and the league’s money gets split along those lines.
The one detail I’ll let out, because almost every free tool gets it wrong: for percentage stats like free-throw %, you have to weight by volume. A 90% shooter who takes two free throws a game barely moves your team. An 84% shooter taking nine a game moves it a lot. Same “skill,” very different real impact.
Reading the whole room
The part I’m proudest of: the live engine doesn’t just watch my wallet — it tracks everyone’s.
The trick
The most you should ever bid isn’t what you can afford — it’s a hair more than what anyone else is willing, and able, to pay. And since all twelve managers are optimizing budget and roster at once, the optimal play has to be recomputed at every bid — game theory, basically.
If the rest of the league is broke or out of roster spots, there’s no reason to pay full price; you’ve already won. So the tool keeps a running model of every rival’s budget and needs, caps my bid accordingly, and nudges toward players who fill holes on my roster.
Why plain math, not a black box
People assume there’s some fancy AI inside. There deliberately isn’t. On draft night I want to be able to defend a number out loud — “he’s worth this much because of his rebounds and his free-throw volume, minus the turnovers” — not shrug at a model I can’t explain. The probability lives where it earns its keep, in the projections. The pricing is transparent on purpose.
That’s the whole thing. It turns the worst thirty seconds of draft night — how much? — into a number I can trust.
It’s about 80% done — there are still rough edges to sand down, and what’s left is mostly validating the results and running some mock drafts.
There’s also a longer wishlist of real-world wrinkles I want it to actually capture — a few among many:
- Availability risk — a player who’s only suited up for half his games is worth far less than his per-game line suggests. (If he’s managed 41 of 82 two years running, do you really want to bet your budget on him?)
- The sophomore slump — second-year players who came back to earth after a scorching rookie season.
- The “too many mouths to feed” problem — too many ball-dominant stars on one NBA team fighting over the same shots and stats, which I’m tackling with a depth-chart model.
- A human override — because my model would never in a million years recommend Kyrie Irving, but hey, some years I just want Kyrie.
But it’s been a genuinely fun project, and a good excuse to point my actuarial training at something with much higher stakes than insurance. And if any of this is up your alley, email me and we can bounce ideas around!
Besides — the romantic lives on. As the betting odds attest, not many people were able to quantitatively conclude the Knicks would win in five. That’s what makes sports beautiful: sometimes there’s an unquantifiable random variable in the mix. It just doesn’t have anything to do with your girlfriend being a six. Let’s goooo Knicks!